Math for AI
The Must-Know Mathematics & Statistics Behind AI
Probability
- probability and conditional probability
1
2
3
probability of an event occuring = # outcomes / total # outcomes

probability of event A happening given B = probability of both events A and B happening / probability of event B happening
Bayes Rule
Naive Bayes
Determine probability of a hypothesis based on prior knowledge and new evidence
1
probability of A happening given B = (probability of B happening given A * Probability of A happening) / probability of event B happening
Business application
- spam email detection - calculate probability that an email is spam, given certain words in the subject/body
- medical diagnosis
- fraud detection
| P(COVID | Test = yes) can be read as: |
1
What is the probability that patient has covid given that test came out to be positive.
Types of Statistics
- Inferential Stats - use a sample to infer about a larger population
- Confidence Intervals - size of transistor on a chip lies in 95% confidence interval [4.95, 5.5] nm.
- Hypothesis Testing - Does the conversion rate of a marketing campaign vary with the font style of infographics?
- Another example, LLM model evaluations comparison to detect the right configuration that works best for a GenAI application.
- A/B testing done on websites on where to place the ads where customer is most likely to click on it
- Descriptive Stats
- Central Tendency
- mean = avg. value in a distribution = sum of data points / total number of data points.
- is not reflective of center of data when extreme values are present.
- this is where median comes in - it identifies the center of the data by sorting the values.
- mean gets skewed towards extreme value
- sensitive to extreme values
- median = mid point in sorted values in a distribution.
- odd number of data points = actual middle number
- even numbers of data points = avg of two middle numbers
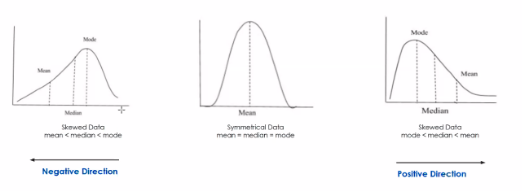
- symmetrical data (See graph below) hence mean = median = mode
- bell curve
- most resilient
- mode = most frequently occurring value in a distribution
- center of data when data is non-numerical
- highest occurring value
- multiple highest occurring values present = multiple modes
- mode gets skewed towards highest value
- mean = avg. value in a distribution = sum of data points / total number of data points.
- Dispersion
- Variance
- Range
- Standard Deviation - how disperse data is in relation to the mean
- low = data clustered around mean value
- high = data is more spread out
- np.std() = numpy has a function for this
- Central Tendency
Matrices
- each row = record
- each column = attribute Example:
- image pixels converted to matrix
- 0 = black
- 255 = white
- grey scale is used to convert each pixel in image to a number based on greyness of the pixel
- for a colored image, scale could be RGB
Dimensionality Reduction
- increasing interpretability of data while preserving the max amount of information
- helps reduce storage space consumed by data
- reduces complexity
This post is licensed under CC BY 4.0 by the author.